What is Network Sniffer?
Network Sniffer also Known as Packet Sniffer is the software tool that is used to Monitors the data flow over computer network links in real-time. Data in the sense Packets, The information that travels across a network is transmitted in the form of “Packets” Network Sniffer software tool is either a self-contained Software or a Hardware device with the appropriate software or firmware. Network Sniffer first examine the streams of the data packet that flow between computers on a network, also using network sniffer you can monitor the data flow between Networked computers and the larger Internet. The Packet is Sent from one computer to another, initially, the packet is broken up into smaller segments with the destination and source address attached, and other useful information. If the Packet Sniffer is installed on your system, then you can analyze the performance of the network could find out the bottleneck in the network. Mostly Packet sniffers are used by Network administrators, it helps them to troubleshoot the network problems, network intrusion deletion system to monitor attackers, finding bottlenecks in networks, and converting binary network data in a human-readable form such as collecting clear usernames and passwords, VoIP communications, mapping network, etc. These are some illegal uses of a packet sniffer unless the administrators have the permission for that particular network in your organization. The packet sniffer can also be referred to as a network analyzer or protocol analyzer.
There are many Network Sniffer tools available in the market, but Wireshark is widely recognized as the most popular network sniffer tool. It is a free, Open source application that is very easy and comfortable to use. Most of the Network administrator suggest to use Wireshark for Network Troubleshooting. Today in this article we are going to see about PktMon.exe, PktMon is an inbuilt Network Sniffer Tool which is integrated with Windows 10 Operating system, This was first included with Microsoft October 2018 update release. This is not an advanced tool like Wireshark. It is a very simple command-line tool, with only a few command lines. This article will guide you to use the PktMon.exe Network Sniffer tool in windows 10.
How to Open PktMon?
PktMon.exe Network Sniffer tool is inbuilt with Microsoft October 2018 updated release and it is located at C:\Windows\system32\pktmon.exe. Pktmon is used to Monitor internal packet propagation and packet drop reports.
Open Command Prompt or PowerShell in elevated mode.
Now navigate the command prompt to C drive, First Type Cd\, and hit enter.
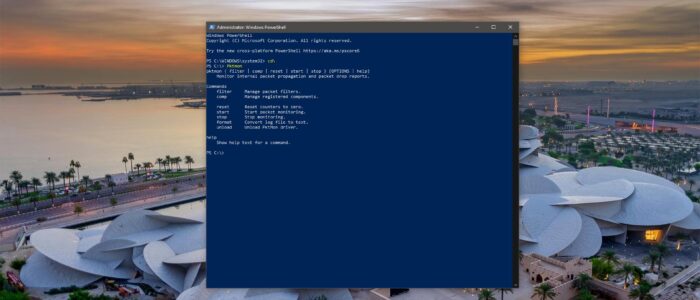
Now type Pktmon and hit enter this will open the Pktmon.exe.
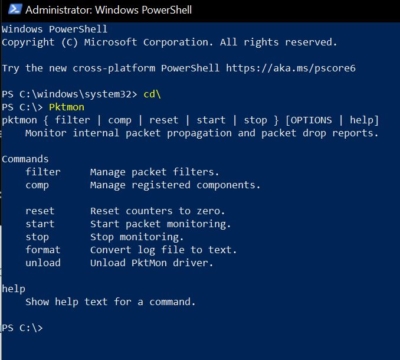
There is no proper guide to use this command, but this article will guide you to use some commands, to monitor network packets.
What are the Commands Included in PktMon?
Once you started the PktMon.exe, type Help, and hit enter this will show the list of available Commands included in PktMon.
- filter Manage packet filters.
- comp Manage registered components.
- reset Reset counters to zero.
- start Start packet monitoring.
- stop Stop monitoring.
- format Convert log file to text.
- unload Unload PktMon driver.
And if you want to get to know more about those commands then type the command with the help. For example, Pktmon filter help this will give you further details about that command. PS C:\> pktmon filter help pktmon filter { list | add | remove } [OPTIONS | help] Commands
- list Display active packet filters.
- add Add a filter to control which packets are reported.
- remove Removes all filters.
You can do the same for other Commands.
How to Use PktMon to Monitor and Troubleshoot?
Troubleshooting a Network contains three-part, first, we have to filter out specific IP or Port to Monitor. Next we need to start monitoring that particular Port or IP. Then finally we have to export that Logs, using that logs we can proceed further to troubleshoot.
Create a Filter:
Network Flow contains a lot of Information without filtering it is very difficult to monitor or troubleshoot, so first, we need to create a filter.
Open command prompt or PowerShell in Elevated mode.
Type the below-mentioned command to command start filter.
Pktmon filter add -p 443
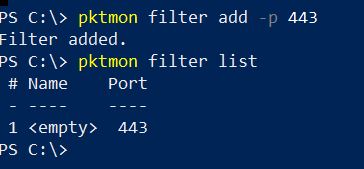
You can get more information about any command by typing help at the end of the command. Once you execute the above-mentioned command the tool will start to filter the particular Port address. Then type Pktmon filter list to list out the captured trace. If you want to remove the Trace type “pktmon filter remove”.
Start Monitoring:
The real troubleshooting needs monitoring, Pktmon is not an automated tool, so after applying filter we need to start the Monitoring manually.
To start Monitoring type the below-mentioned command,
pktmon start –etw -p 0 -c 40
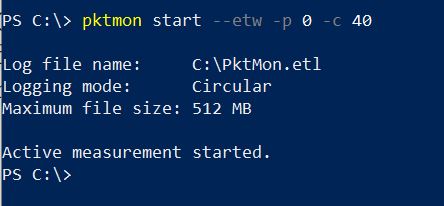
Here the Pktmon start is the command that helps you to start the monitoring, then – -etw is Event Tracing for Windows that starts a logging session for packet capture. -c indicates the components, if you list out the filter details you can see the component ID, by choosing the ID you can Monitor only that particular component. If you want to know more about Monitoring, get help by typing help at the end of the command. Pktmon start help Once you execute this command it will start the monitoring and create a log file in the C drive. As I mentioned about it is not an automated tool so you need to stop it manually using the “stop” argument. Type Pktmon Stop to stop the Monitoring.
Export the Logfile:
The monitoring command will leave the log file in C drive. But you can’t open this because this fill is saved in ETL format, ETL files are log files that have been created by the Microsoft Tracelog software application.
Using Pktmon tool we can convert this ETL log file to a human-readable format like text file format. Type below mentioned command to change the file format.
pktmon format PktMon.etl -o component_ID_40.txt
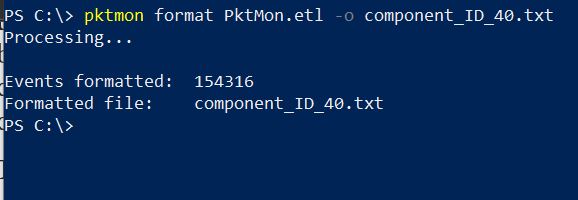
Note: Changing the ETL file location from C drive won’t process the command. After the Execution of the command you can see the converted file in C drive itself. To know more about these commands use help at the end of the command. if you want to get a clear picture of ETL file format download and install Microsoft Network Monitor tool.
Read Also:
How to use Multiple Internet connections at same time in Windows 11/10?


Alwasy get the error “-p 0” not a valid provider???? Wha?